Heikin Ashi & Swing Highs/LowsHeikin Ashi & Swing Highs/Lows
Indicator Description:
The "Heikin Ashi & Swing Highs/Lows" indicator combines Heikin Ashi candle analysis with the identification of significant swing highs and lows on the chart. This indicator is useful for traders looking to spot trend changes and key points in the market.
Key Features:
Heikin Ashi:
Calculation and Visualization: Utilizes the Heikin Ashi method to smooth out the candlestick chart, helping to visualize trends and reduce market noise. Heikin Ashi candles are calculated from the standard candles (Open, High, Low, Close) and are displayed on the chart with a green color for bullish signals and red for bearish signals.
Vertical Offset Adjustment: Provides options to adjust the vertical offset of the candles based on the selected timeframe, with specific adjustments for short, medium, long, and super-long periods.
Swing Highs/Lows:
Key Point Identification: Marks significant swing highs and lows on the chart using a configurable period. Swing highs are displayed in red and swing lows in green.
Candlestick Patterns: Detects and labels common candlestick patterns such as:
Hammer: A bullish candlestick pattern with a small body and a long lower wick.
Inverted Hammer: Similar to the Hammer, but with a long upper wick.
Bullish Engulfing: A two-candle pattern where a bullish candle completely engulfs a previous bearish candle.
Hanging Man: A bearish pattern with a small body and a long lower wick, appearing at the end of an uptrend.
Shooting Star: A bearish pattern with a small body and a long upper wick, appearing at the end of an uptrend.
Bearish Engulfing: A two-candle pattern where a bearish candle completely engulfs a previous bullish candle.
Settings:
Timeframe: Allows you to select the desired timeframe to adjust the Heikin Ashi candle analysis.
Vertical Offset: Customize the vertical offset of Heikin Ashi candles based on the selected timeframe.
Swing Point Style: Configure the colors of the significant swing highs and lows on the chart.
Recommended Use:
This indicator is ideal for traders looking for a clear representation of trends through Heikin Ashi candles and who want to identify key reversal points in the market by detecting swing highs/lows and candlestick patterns.
Benefits:
Facilitates the identification of smooth trends and trend reversals.
Provides a clear visual representation of critical market points.
Helps traders recognize important candlestick patterns that may indicate changes in market direction.
Cari dalam skrip untuk "Heikin Ashi"

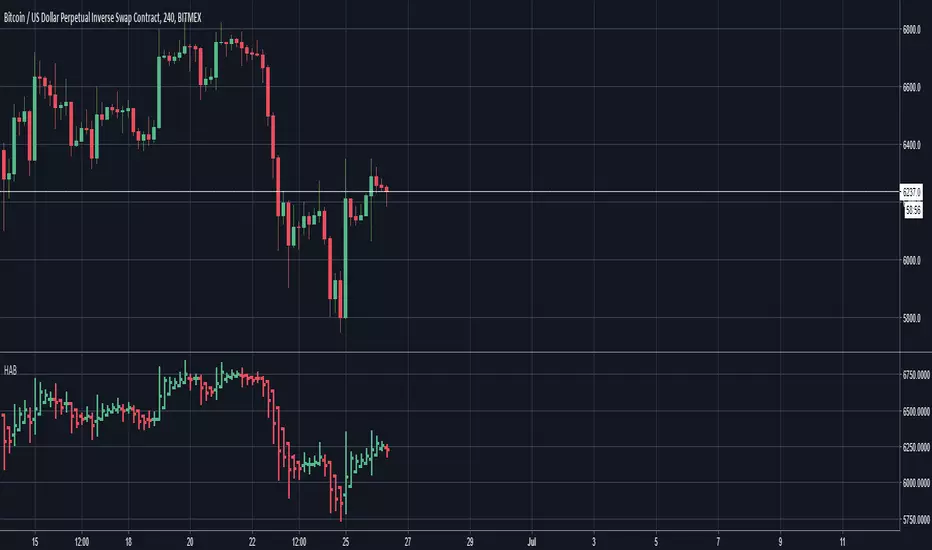
Heikin Ashi VolumeHeikin Ashi candles decrease market noise so that broader trends can be more easily visualized. In a typical chart utilizing Heikin Ashi candles, volume bars are colored in such a way that they also allow for the visualization of trends during a bullish/bearish move.
The Heikin Ashi Volume indicator allows the trader to continue to use the same volume bar coloring technique to visualize trends without having to utilize the Heikin Ashi candles, since a Heikin Ashi candle’s OHLC values are not true prices but instead based on calculations in order to provide the ‘denoising’ effect they are known for.
In addition to providing the Heikin Ashi Volume coloring effects, the Heikin Ashi Volume indicator also allows the user to set a volume threshold level where the bar colors will be darker unless volume is beyond that threshold, helping traders quickly determine if there is enough participation in the market at that time to justify taking risk in a trade when the market isn’t very active. The user has the option to show or hide the threshold line, change the colors of the bullish/bearish colors (for both above and below threshold volumes) and the option for the indicator to gradually brighten the bar colors are they approach the threshold instead of having a clear line of demarcation showing volume above or below the set threshold.

Heikin-Ashi MACD"Heikin-Ashi, also sometimes spelled Heiken-Ashi, means "average bar" in Japanese. The Heikin-Ashi technique can be used in conjunction with candlestick charts when trading securities to spot market trends and predict future prices. It's useful for making candlestick charts more readable and trends easier to analyze. For example, traders can use Heikin-Ashi charts to know when to stay in trades while a trend persists but get out when the trend pauses or reverses. Most profits are generated when markets are trending, so predicting trends correctly is necessary."
HA bars help us to smooth the price action, and I think MACD gives me a lot of signals and I need to eliminate them and add MACD strategy on Heiken-Ashi candles to look performance.
Mostly, it eliminates %75 of the signals, and most of the time it did increase backtest performance significantly.
There is still a way to it to combine other indicators for complete strategy, but at least We can achieve better MACD with this approach.


CM Heikin-Ashi Candlesticks_V1Heikin-Ashi Paint Bars.
Paints Candlesticks or OHLC Bars The Exact Same as Traditional Heikin-Ashi Bars

HEIKIN ASHI COLOUR CHANGE ALERTThis can be used to trigger an alert if Heikin Ashi bar changes color :)

Heikin-Ashi Smoothed with option to change MA types CryptoJoncisPine Script version=3
Author CryptoJoncis
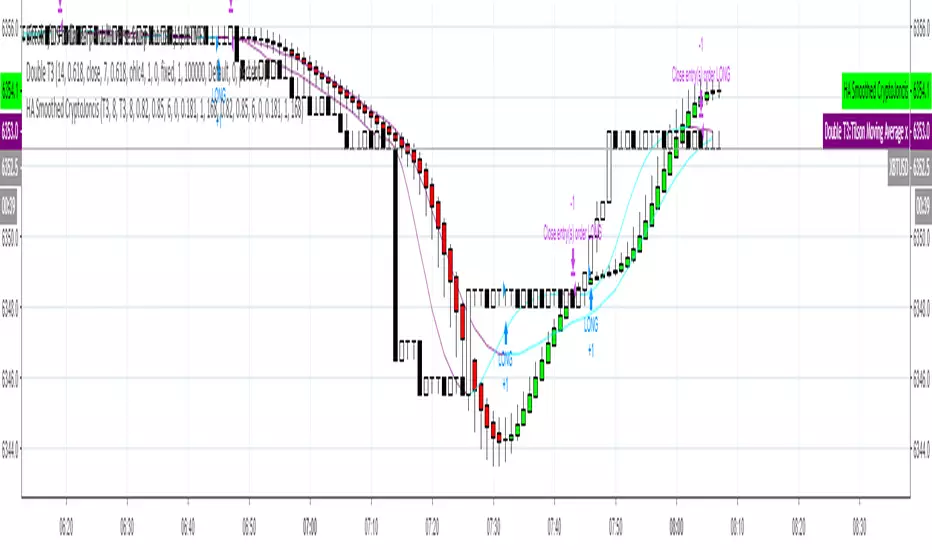
Heikin-Ashi Smoothed
The Heikin-Ashi Smoothed study is based upon the standard Heikin-Ashi study with additional moving average calculations. The following is the calculation formula for the bars:
1. The current bar Open, High, Low, Close values are smoothed individually by using the moving average type specified by the Moving Average Type 1 Input with a length/period specified by the Moving Average Period 1 Input.
2. The Heikin-Ashi bar Open, High, Low, Close values are set using the smoothed values from step 1. This is performed using the standard Heikin-Ashi formula.
3. The final Heikin-Ashi Open, High, Low, Close values are calculated by doing a second smoothing of the bar values from step 2 by using the moving average type specified by the Moving Average Type 2 Input with a length/period specified by the Moving Average Period 2 Input.
If you choose to tick the box where it offers to use only one smoothed HA then it skips the third/final step and you do not need to choose the second MA type for it to work.
Remember, using FRAMA, always make sure you use even number for length.
For simple Heikin-Ashi, please tick single smoothed and DEFAULT (Not smoothed as there are no MA used)
Heikin-Ashi bars are calculated:
1. Close = (Open + High + Low + Close) / 4
This is the average price of the current bar.
2. Open = (Open of Previous Bar + Close of Previous Bar) / 2
This is the midpoint of the previous bar.
3. High = Max of (High, Open, Close)
Highest value of the three.
4. Low = Min of (Low, Open, Close)
Lowest value of the three.
Any questions/suggestions/errors or spelling mistakes? Please leave a comment and let me know. I will try to fix it.
This took me few days to finish, so I hope you will find it useful.
Would you like to have more MA type choices? Please comment down with any other which aren't included in this indicator and I will research them and add.
MA included in this script:
Tillson Moving Average (T3)
Double Exponential Moving Average (DEMA)
Arnaud Legoux Moving Average (ALMA)
Least Squares Moving Average (LSMA)
Simple Moving Average (SMA)
Exponential Moving Average (EMA)
Weighted Moving Average (WMA)
Smoothed Moving Average (SMMA)
Triple Exponential Moving Average (TEMA)
Hull Moving Average (HMA)
Adaptive moving average (AMA)
Fractal Adaptive Moving Average (FAMA)
Variable Index Dynamic Average (VIDYA)
Triangular Moving Average (TRIMA)
You can use,publish,modify this code in any way as you wish, but only if you reference me after.
You are not allowed to sell it as it is.
If this code is useful to you, then consider to buy me a coffee (or better a pint of beer) by donating Bitcoin or Etherium to:
BTC: 3FiBnveHo3YW6DSiPEmoCFCyCnsrWS3JBR
ETH: 0xac290B4A721f5ef75b0971F1102e01E1942A4578
References:
www.sierrachart.com
www.investopedia.com
www.binarytribune.com
www.investopedia.com
www.stockfetcher.com
www.mql5.com
www.incrediblecharts.com
help.cqg.com
www.blastchart.com
Heikin Ashi CountObjective:
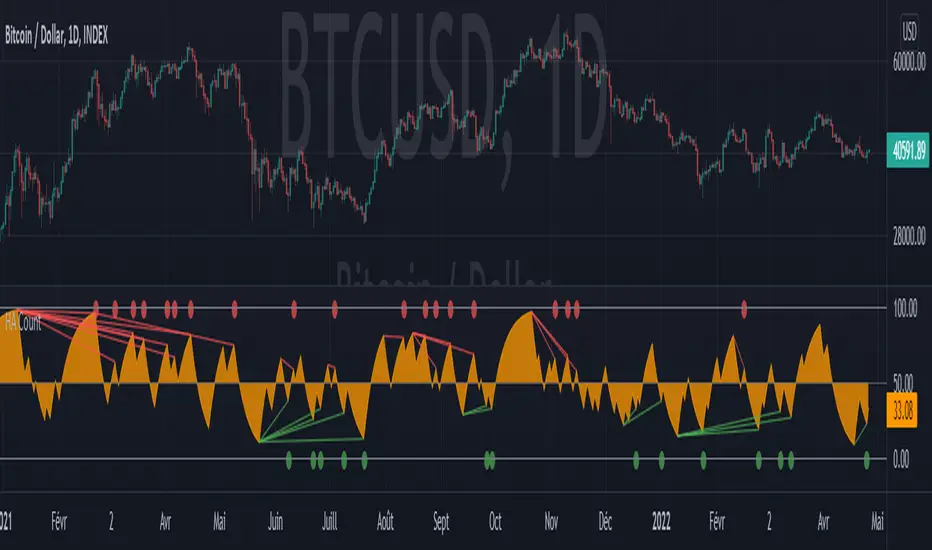
This indicator aims to obtain an oscillator indicating the trend of a market by minimizing noise through the use of Heikin Ashi candles.
The idea is to make the oscillator tend towards 100 at each bullish Heikin Ashi candle, and inversely towards 0 when bearish.
The advantage is that this indicator has little noise compared to the RSI, but also little lag compared to the Schaff Trend Cycle, which are the two indicators that inspired me to create this one.
Usage:
As a general rule, below 15, HA Count indicates an oversell and above 85 an overbuy.
Setting the length for the candle count results in an indicator that is less sensitive when close to 1 and more sensitive when it is at 2 or higher.
Chosen as the default value, 1.15 seems to give the best indications, regardless of the market or time period.
Also it looks very similar to the values that the RSI could give set over 14 periods, so it can be used in the same way. Especially with regard to divergences.
---- FR ----
Objectif :
Cet indicateur vise à obtenir un oscillateur indicant la tendance d'un marché en minimisant le bruit grace à l'utilisation des bougies Heikin Ashi.
L'idée est de faire tendre l'oscillateur vers 100 à chaque bougie Heikin Ashi haussière, et inversement vers 0 lorsque baissière.
L'avantage est que cet indicateur a peu de bruit comparé au RSI, mais peu de lag aussi comparé au Schaff Trend Cycle, qui sont les deux indicateurs qui m'ont inspiré pour la création de celui-ci.
Utilisation :
En régle général, en dessous de 15 HA Count indique une sur-vente et au-dessus de 85 un sur-achat.
Le paramétrage de la longueur pour le comptage de bougie permet d'obtenir un indicateur moins sensible lorsque proche de 1 et plus sensible lorsqu'il est à 2 ou supérieur.
Choisie comme valeur par défaut, 1.15 semble donner les meilleures indications, peu importe le marché ou la période de temps.
En outre cela ressemble beaucoup aux valeurs que pourrait donner le RSI régler sur 14 périodes, ainsi il peut être utilisé de la même manière. Notamment pour ce qui est des divergences.
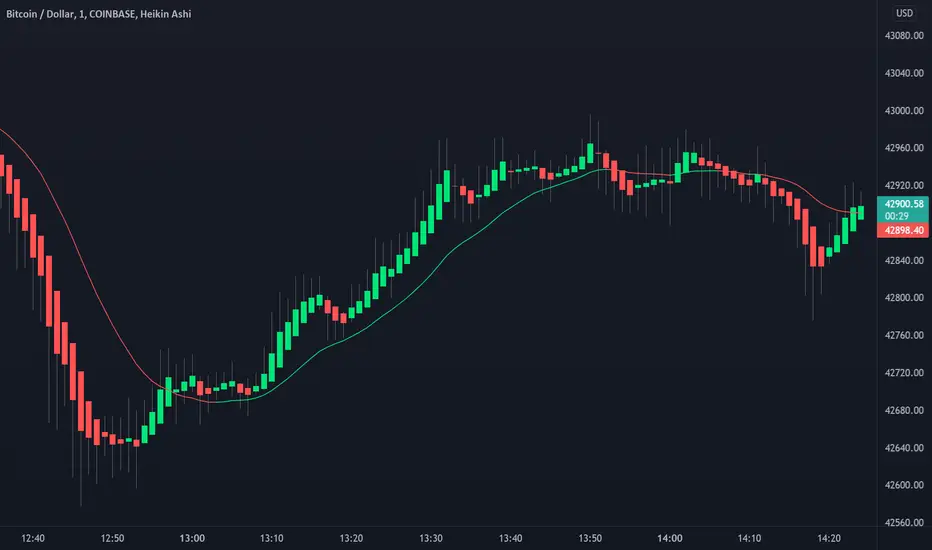
Heikin Ashi Candles [Improved] - real closing priceHeikin Ashi Candles - with real closing price!, and with a Heikin Ashi based moving average!
One of the main functionality of Heikin Ashi is to provide a smoothed price to get clarity in trends. This script builds upon the Heikin Ashi Candlestick I published in 2020 that took the standard Heikin Ashi calculations and added the actual closing price.
The improved version adds a new smoothing calculation to give traders an even better way to display trends. In addition to that, a Heikin Ashi based moving average is added to guide you to take trades in the trend direction. The best part is the users have the ability to display both the real closing price and the Improved Heikin Ashi closing price.
With a few modifications within the smoothing settings, the users can get features like Candle Cloud that provides traders with functionalities like Ichimoku clouds.
Usage:
This indicator serves as a trend tool with enhanced features of the original Heikin Ashi calculations. The indicator help traders to take trades in the same direction of the trend. The new improved version gives traders a new better way to make use of all Heikin Ashi strategies that have been developed during the years. Apply the same methods with this new version.
Disclaimer: No financial advice, only for educational/entertainment purposes.
Heikin Ashi SupertrendAbout this Strategy
This supertrend strategy uses the Heikin Ashi candles to generate the supertrend but enters and exits trades using normal candle close prices. If you use the standard built in Supertrend indicator on Heikin Ashi candles, it will produce very unrealistic backtesting results because it uses the Heikin Ashi prices instead of the real prices. However, by signaling the supertrend reversals using Heikin Ashi while using standard candle close prices for the entries and exits, it corrects the backtesting errors and gives you a more realistic equity curve. You should set the chart to use standard candles and then hide them (the strategy creates the candles).
This strategy includes:
Plotting of Heikin Ashi candles
Heikin Ashi Supertrend
Long and Short Entry Signals
Move stop loss after trade is X% in profit
Profit Target
Stop Loss
Built in Alertatron automation
Alertatron Trade Automation Integration
For Alertatron integration, be sure to configure the strategy settings and "Enable Webhook Messages" before creating an alert with {{strategy.order.alert_message}} in the body of your alert message. Be sure to enable webhooks and point it to your Incoming Alertatron webhook URL.
Notes
While this strategy does pretty well during trending markets, It's worth noting that the Buy and Hold ROI is much better during peak times of the bull market
Not financial advice. Do not risk more than you can afford to lose.

Heikin Ashi Candle Startegy for Long PositionThis strategy utilize Heikin-Ashi candlestick chart.
Heikin-Ashi technique is a Japanese candlestick-based technical trading tool that uses candlestick charts to represent and visualize market price data.
Heikin-Ashi candle is essentially taking an average of the movement.
There is a tendency with Heikin-Ashi for the candles to stay red during a downtrend and green during an uptrend.
This strategy only apply for long trading position.
The idea is trader will waiting 3 green candles for validation period (confirmation) before entering long position.
Different timeframe will result different result.
Number of validation period can be changed to see different result
This strategy has parameter for take profit percentage, trailing stop and stop loss.
User can set maximum active position to minimize risk and qty order.
This tool is useful for user who wants to backtest Heikin-Ashi trading strategy.
Script will emit alert when long position is opened and closed.
Warning of Backtesting
Backtesting is backward-looking. As the name implies, you are testing how something would have worked if you traded it perfectly in the past.
Past performance does not indicate future performance and you should not assume it does.
Backtesting assumes you never miss-fire, that you get in and out at the exactly perfect moment each time.
Backtesting assumes you have perfect liquidity, and your limit orders fill at a specific, pre-defined price every time (either the open, close, low, high, or some average of these).
Disclaimer
Do your own research and consider fundamental price of asset.
The indicators provided on this script is for educational purposes only.
Author does not offer advisory or brokerage services, nor does it recommend or advise users to buy or sell particular stocks or securities.
Please examined script and give feedback for further improvement.
Script are open to public, everyone see and clone source code or just apply to chart. Please make comment for improvement.

Heikin Ashi Trend IndicatorMy own implantation of Heikin Ashi which i call HAT.
The Heikin Ashi Trend Indicator (HAT) used to determine the price direction of an asset, as well as draw attention to when the price direction is changing.
The HAT indicator translates the current close/open/high/low into Heikin Ashi and smooths them a bit using Tilson T3 formula.
Buy signal when Heikin Ashi Close is bigger than Heikin Ashi Open with Tilson T3 smoothing.
Sell signal when Heikin Ashi Open is bigger than Heikin Ashi Close with Tilson T3 smoothing.
Set the 'percentSqueeze' percentage to display possible reversal with light Red/Green crosses.
Green - Up Trend
Light Green - Possible reversal is near
Red - Down Trend
Light Red - Possible reversal is near
Follow for more indicators: www.tradingview.com

Heikin Ashi Volatility Percentile - TraderHalaiThe Heikin Ashi Volatility Percentile (HAVP) Oscillator was inspired by the legendary Bollinger Band Width Percentile indicator(known as BBWP), written by Caretaker, and made famous by Eric Krown, a famous influencer.
This script borrows aspects of the BBWP indicator which enables the HAVP oscillator to visually match the look and feel of BBWP and allows similar configuration functions (such as colouring function, smoothing MAs and alerts)
The fundamentals of this script are however different to BBWP. Instead of Bollinger band width, this script uses a reverse function of Heikin Ashi close (implemented in my Smoothed Heikin Ashi Trend
indicator, linked below).
The reverse Heikin Ashi close is smoothed using Ehler's SuperSmoother function, providing smooth oscillation and earlier signals of volatility tops and bottoms.
From an automated backtest that I have conducted on the BTCUSD index pair, I have observed comparable performance to BBWP across multiple timeframes when combining with stochastic direction to give a bias on overall direction. Using parameters I have tested, it performs better on mid-term timeframes such as 3h,4h and 6h. BBWP outperforms on 1h and 1d, with lower timeframes being comparable.
From the results, using HAVP over BBWP tends to result in reduced holding time and more frequent trades, which may or may not be desirable, although the behaviour can be adjusted using the parameters provided.
For instance, the smoother oscillation provided by HAVP provides a great predictability factor and earlier confirmation signals, which is something that Ehler emphasised in his trading style, and something which I agree with personally. I would encourage you to try out both HAVP and BBWP and see which fits your trading style.
Releasing this as open source allows for the betterment of the community and further development, criticism and discussion.
Thanks and enjoy! :)

Heikin Ashi Candles - Actual CloseHeikin Ashi Candles - Actual Close is a simple script that instead of displaying Heikin Ashi Close it displays the actual close.
This script is a handy tool for anyone that wants to use Heikin Ashi candles that displays the real close. The coloring of the candles is still based on the Heikin Ashi calculations.
Enjoy.

Heikin Ashi RSI + OTT [Erebor]Relative Strength Index (RSI)
The Relative Strength Index (RSI) is a popular momentum oscillator used in technical analysis to measure the speed and change of price movements. Developed by J. Welles Wilder, the RSI is calculated using the average gains and losses over a specified period, typically 14 days. Here's how it works:
Description and Calculation:
1. Average Gain and Average Loss Calculation:
- Calculate the average gain and average loss over the chosen period (e.g., 14 days).
- The average gain is the sum of gains divided by the period, and the average loss is the sum of losses divided by the period.
2. Relative Strength (RS) Calculation:
- The relative strength is the ratio of average gain to average loss.
The RSI oscillates between 0 and 100. Traditionally, an RSI above 70 indicates overbought conditions, suggesting a potential sell signal, while an RSI below 30 suggests oversold conditions, indicating a potential buy signal.
Pros of RSI:
- Identifying Overbought and Oversold Conditions: RSI helps traders identify potential reversal points in the market due to overbought or oversold conditions.
- Confirmation Tool: RSI can be used in conjunction with other technical indicators or chart patterns to confirm signals, enhancing the reliability of trading decisions.
- Versatility: RSI can be applied to various timeframes, from intraday to long-term charts, making it adaptable to different trading styles.
Cons of RSI:
- Whipsaws: In ranging markets, RSI can generate false signals, leading to whipsaws (rapid price movements followed by a reversal).
- Not Always Accurate: RSI may give false signals, especially in strongly trending markets where overbought or oversold conditions persist for extended periods.
- Subjectivity: Interpretation of RSI levels (e.g., 70 for overbought, 30 for oversold) is somewhat subjective and can vary depending on market conditions and individual preferences.
Checking RSIs in Different Periods:
Traders often use multiple timeframes to analyze RSI for a more comprehensive view:
- Fast RSI (e.g., 8-period): Provides more sensitive signals, suitable for short-term trading and quick decision-making.
- Slow RSI (e.g., 32-period): Offers a smoother representation of price movements, useful for identifying longer-term trends and reducing noise.
By comparing RSI readings across different periods, traders can gain insights into the momentum and strength of price movements over various timeframes, helping them make more informed trading decisions. Additionally, divergence between fast and slow RSI readings may signal potential trend reversals or continuation patterns.
Heikin Ashi Candles
Let's consider a modification to the traditional “Heikin Ashi Candles” where we introduce a new parameter: the period of calculation. The traditional HA candles are derived from the open 01, high 00 low 00, and close 00 prices of the underlying asset.
Now, let's introduce a new parameter, period, which will determine how many periods are considered in the calculation of the HA candles. This period parameter will affect the smoothing and responsiveness of the resulting candles.
In this modification, instead of considering just the current period, we're averaging or aggregating the prices over a specified number of periods . This will result in candles that reflect a longer-term trend or sentiment, depending on the chosen period value.
For example, if period is set to 1, it would essentially be the same as traditional Heikin Ashi candles. However, if period is set to a higher value, say 5, each candle will represent the average price movement over the last 5 periods, providing a smoother representation of the trend but potentially with delayed signals compared to lower period values.
Traders can adjust the period parameter based on their trading style, the timeframe they're analyzing, and the level of smoothing or responsiveness they prefer in their candlestick patterns.
Optimized Trend Tracker
The "Optimized Trend Tracker" is a proprietary trading indicator developed by TradingView user ANIL ÖZEKŞİ. It is designed to identify and track trends in financial markets efficiently. The indicator attempts to smooth out price fluctuations and provide clear signals for trend direction.
The Optimized Trend Tracker uses a combination of moving averages and adaptive filters to detect trends. It aims to reduce lag and noise typically associated with traditional moving averages, thereby providing more timely and accurate signals.
Some of the key features and applications of the OTT include:
• Trend Identification: The indicator helps traders identify the direction of the prevailing trend in a market. It distinguishes between uptrends, downtrends, and sideways consolidations.
• Entry and Exit Signals: The OTT generates buy and sell signals based on crossovers and direction changes of the trend. Traders can use these signals to time their entries and exits in the market.
• Trend Strength: It also provides insights into the strength of the trend by analyzing the slope and momentum of price movements. This information can help traders assess the conviction behind the trend and adjust their trading strategies accordingly.
• Filter Noise: By employing adaptive filters, the indicator aims to filter out market noise and false signals, thereby enhancing the reliability of trend identification.
• Customization: Traders can customize the parameters of the OTT to suit their specific trading preferences and market conditions. This flexibility allows for adaptation to different timeframes and asset classes.
Overall, the OTT can be a valuable tool for traders seeking to capitalize on trending market conditions while minimizing false signals and noise. However, like any trading indicator, it is essential to combine its signals with other forms of analysis and risk management strategies for optimal results. Additionally, traders should thoroughly back-test the indicator and practice using it in a demo environment before applying it to live trading.
The following types of moving average have been included: "SMA", "EMA", "SMMA (RMA)", "WMA", "VWMA", "HMA", "KAMA", "LSMA", "TRAMA", "VAR", "DEMA", "ZLEMA", "TSF", "WWMA". Thanks to the authors.
Thank you for your indicator “Optimized Trend Tracker”. © kivancozbilgic
Thank you for your programming language, indicators and strategies. © TradingView
Kind regards.
© Erebor_GIT

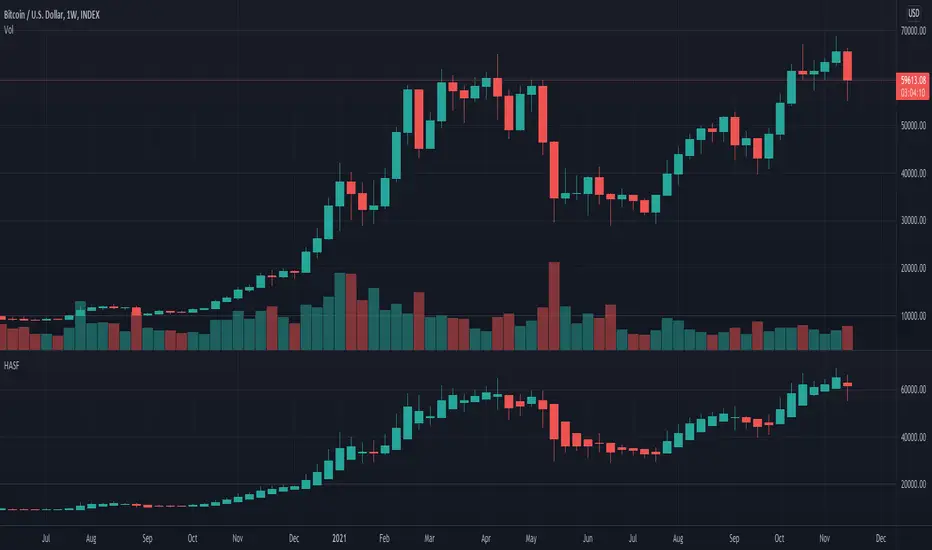
Heikin Ashi CandlesLibrary "heikin_ashi_candles"
This library is programmed to calculate the Heikin Ashi candles using the standard formula of Heikin Ashi Candles.
Notice the Heikin Ashi chart type isn't 100% like the results from this calculation.
You can import this library in your code to use it as a smoothing method for your strategy which operates on the standard chart type.
_close()
_open()
_high()
_low()
_ohlc4()
_hlcc4()
_hlc3()
_hl2()

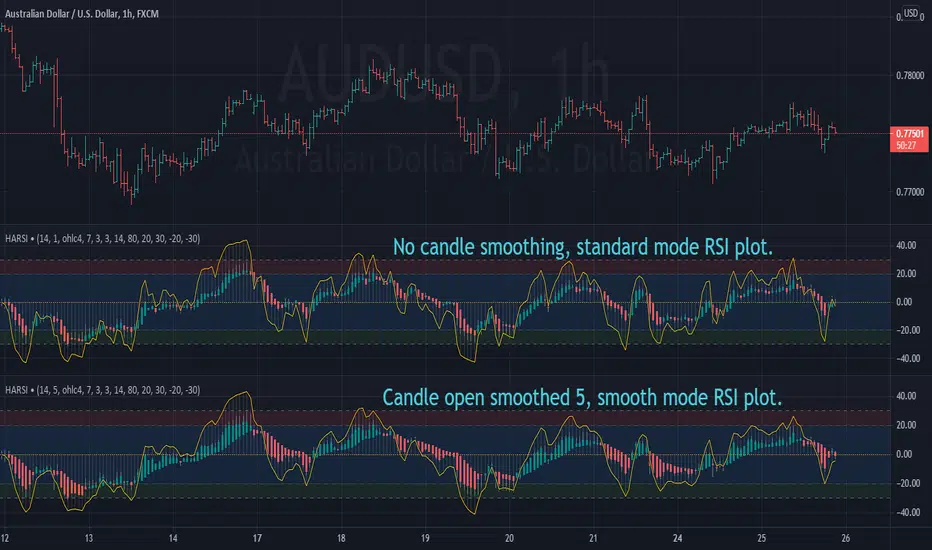
Heikin Ashi RSI OscillatorIntroducing HARSI - the RSI based Heikin Ashi candle oscillator.
...that's right, you read it correctly. This is Heikin Ashi candles in an oscillator
format derived from RSI calculations, aimed at smoothing out some of the
inherent noise seen with standard RSI indicators.
Science!
We likes it we does.
Included plot options for standard RSI plot overlay, and a smoothed variant with
it's own seperate length from the candles, oh and histogram option, for reasons.
Articles and further reading:
investopedia.com - RSI
investopedia.com - Heikin Ashi
This is a REALTIME indicator, so any values used for conditions should use
history 1, or alternatively, alerts should be called using once-per-bar-close.
Heikin Ashi Bar OverlayThis script shows Heikin Ashi bars on your chart with specified vertical offset
Heikin-Ashi Source FunctionCustom source function for toggling traditional Candle sources or Heikin-Ashi sources on a traditional Candles chart.
Thanks to PineCoders for rounding method: www.pinecoders.com
Thanks to @LucF and @RicardoSantos for their advice and enlightenment as always.
NOTICE: This is an example script and not meant to be used as an actual strategy. By using this script or any portion thereof, you acknowledge that you have read and understood that this is for research purposes only and I am not responsible for any financial losses you may incur by using this script!
Heikin-Ashi Trend AlertThis script:
Adds a Heikin-Ashi line to the chart (EMA-based).
Provides alerts triggered when the color goes from green to red and vice versa.
Just add the indicator to the chart, create an alert and select " Heikin-Ashi Trend Alert " from the dropdown. Profit.

Heikin-Ashi Candle ColoringThis script will change the color of normal candlesticks to the color that the corresponding Heikin-Ashi candles would have.
This allows to spot a trend or a trend reversal just by looking at candles, without using Heikin-Ashi candles, which distort the appearance of a typical chart.

